• Design Research
  • Product Design
  • Illustration
  • Blog
  • About
Menu

Meg McLaughlin

  • Design Research
  • Product Design
  • Illustration
  • Blog
  • About

Blog

Thoughts on design process, works in progress, and  some doodles.


Double diamond

January 25, 2018

I created this diagram [below] while working at Jackrabbit Mobile, to help explain the design process to coworkers and clients alike. I used the Double Diamond by Dan Nester as a jumping off point. When I shared that diagram with non-designers, I found that it was good at orienting people to the work I was doing, but it took a lot of explanation. 

Basic diagram to open conversation about design

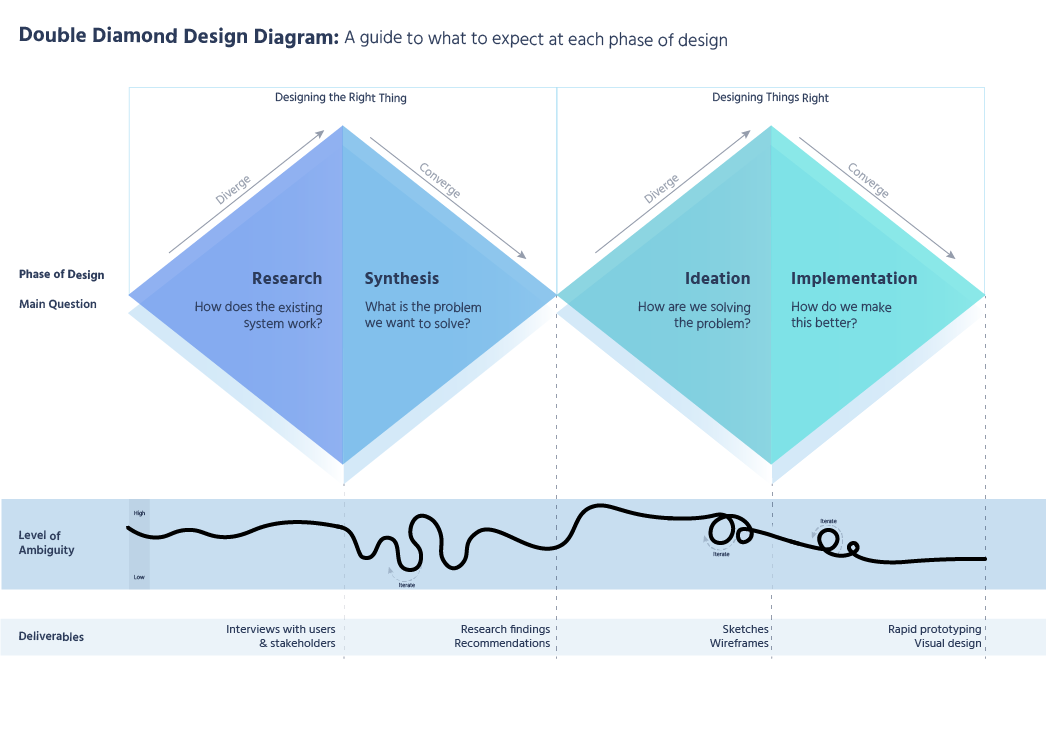
I broke out the things non-designers wanted to know and created my own version of the Double Diamond:

  • What are the phases of design?
  • What happens in each of those phases?
  • When can we expect X deliverable?
The original version of the diagram showed white lines that I moved around to help teammates visualize how we could shift time spent on each phase of design to meet the client's needs.

The original version of the diagram showed white lines that I moved around to help teammates visualize how we could shift time spent on each phase of design to meet the client's needs.

I noticed an immediate change in the way my coworkers talked about design after sharing this with them- we were able to use shared language! 


Adding Emotional Experience

As our projects moved on, anxieties crept up. During Synthesis, I noticed that I was getting many questions about the process and what to expect next.

To me, these questions weren't unexpected, but I was struggling to answer my coworker's inquiries in a way that really calmed their nerves. Repeating deadlines, showing examples from other projects, and updates from me weren't quite enough to ease my coworker's worries. 

Once I had finished the Synthesis phase, I decided to map out what my coworkers were feeling as a mini-experience map below the Double Diamond. I saw that it was instantly reassuring to walk through this map together, and it could be a great tool for setting expectations with clients as well. 

Design Process with Experience Map.png
In Design Process, Storytelling Tags Diagrams, Visualizations
← App design based on a podcastSex Ed Research & Hackathon →
  • 2018
    • Sep 19, 2018 Research chair
    • Aug 15, 2018 App design based on a podcast
    • Jan 25, 2018 Double diamond
  • 2017
    • May 18, 2017 Sex Ed Research & Hackathon
    • Feb 8, 2017 Wiked
  • 2016
    • Nov 8, 2016 FoTO
    • Jun 17, 2016 Bubblr
    • May 10, 2016 Openly Quizzes
  • 2015
    • Dec 19, 2015 ColdTowne Theater
    • Oct 16, 2015 Songs in the Sitting Room
More Posts
Research chair tweet image
Research chair
Screen Shot 2020-11-12 at 12.16.15 AM.png
App design based on a podcast
Diagrams, Visualizations
Double diamond
Diagrams, Visualizations
Sex Ed Research & Hackathon
Research, Ideation, Presentation
Sex Ed Research & Hackathon
Research, Ideation, Presentation
Wiked
video, Presentation, design thinking, theory
Wiked
video, Presentation, design thinking, theory
Foto unicorn
Ideas, Storytelling
FoTO
Ideas, Storytelling
Ideas, Storytelling
Bubblr
Ideas, Behavior, Visualizations
Bubblr
Ideas, Behavior, Visualizations
Openly Quizzes
design process
Openly Quizzes
design process
design process
Coldtowne Lobby
service design, interaction design, ixd, comedy, journey map
ColdTowne Theater
service design, interaction design, ixd, comedy, journey map
Songs in the Sitting Room
ideation, illustration, community
Songs in the Sitting Room
ideation, illustration, community